Tachi - eBPF Memory Tracer
Introduction
Previously, we discussed eBPF’s history and features, learning how it works and the subsystems it utilizes to provide a rich set of capabilities. We saw how eBPF could be used as a powerful tool at the hands of a malicious actor. In this post we will explore a different usage of eBPF, harnessing eBPF to understand a process’s heap allocation behavior.
eBPF is leveraged as an observability tool for networks and packet filtering. That is but one use-case out of many others. It provides us tools to peer into all the inner machinery of the system - user and kernel mode, remote and local traffic. We can harness Uprobes again (if you recall the previous post, Uprobes was the main character there) to trace a program’s heap allocation behavior, like Valgrind but with hooks.
This post showcases Tachi - a heap tracing tool I developed.
What is Heap Tracing?
Heap tracing is a technique that allows us to inspect events (allocating, freeing, reallocation) in the heap during runtime and gain a clear timeline and info of the sizes and locations of memory chunks being used by the program. This is beneficial to:
- Realtime understanding of program behavior
- Performance monitoring
- Vulnerability research
Concepts
Our heap tracing engine will collect data by using Uprobes to hook malloc, calloc, realloc and free from the GLIBC (focusing specifically on programs using this allocator). By hooking these functions we can track what is allocated, where it is allocated and who (the address of the caller) allocates it.
We create several hooks, to collect data from each selected allocation function. Uprobes enable us to hook usermode functions (Where Kprobes allows the same but in the kernel) both at their entry and just before they return. With a hook at the entrance we collect the event itself, process id, thread id, the address in the code where malloc was called - we do that by dereferencing the stack pointer we receive in the context. At that address we will find the saved return address for malloc to return to after it finishes (actually the return address will be the instruction after malloc).
SEC("uprobe/malloc")
int malloc_enter(struct pt_regs* ctx) {
    __u64 pid_tgid = bpf_get_current_pid_tgid();
    __u32 tid = (__u32)pid_tgid;
    struct alloc_entry entry = {};
    entry.size = PT_REGS_PARM1(ctx);
    entry.type = EVENT_MALLOC;

    bpf_probe_read_user(&entry.caller, sizeof(entry.caller), (void*)PT_REGS_SP(ctx));
    bpf_map_update_elem(&alloc_entry_map, &tid, &entry, BPF_ANY);

    return 0;
}
The malloc return is also hooked to retrieve its return value, which is the address where the allocated chunk can be found in the heap.
SEC("uretprobe/malloc")
int alloc_exit(struct pt_regs* ctx) {
    __u64 pid_tgid = bpf_get_current_pid_tgid();
    __u32 pid = pid_tgid >> 32;
    __u32 tid = (__u32)pid_tgid;
    __u64 addr = PT_REGS_RC(ctx);

    struct alloc_entry* entry = bpf_map_lookup_elem(&alloc_entry_map, &tid);
    if (!entry)
        return 0;

    bpf_map_delete_elem(&alloc_entry_map, &tid);

    if (addr == 0 && entry->type != EVENT_REALLOC)
        return 0;

    struct event* e = bpf_ringbuf_reserve(&events, sizeof(*e), 0);
    if (!e)
        return 0;

    e->pid = pid;
    e->tid = tid;
    e->size = entry->size;
    e->addr = addr;
    e->caller = entry->caller;
    e->old_addr = entry->old_addr;
    e->type = entry->type;

    bpf_ringbuf_submit(e, 0);
    return 0;
 }
For free we do the same thing we did with the malloc hook.
SEC("uprobe/free")
int free_enter(struct pt_regs* ctx) {
    __u64 pid_tgid = bpf_get_current_pid_tgid();
    __u32 pid = pid_tgid >> 32;
    __u32 tid = (__u32)pid_tgid;
    __u64 addr = PT_REGS_PARM1(ctx);

    if (addr == 0)
        return 0;

    struct event* e = bpf_ringbuf_reserve(&events, sizeof(*e), 0);
    if (!e)
        return 0;

    e->pid = pid;
    e->tid = tid;
    e->size = 0;
    e->addr = addr;
    e->old_addr = 0;
    bpf_probe_read_user(&e->caller, sizeof(e->caller), (void*)PT_REGS_SP(ctx));
    e->type = EVENT_FREE;

    bpf_ringbuf_submit(e, 0);
    return 0;
 }
With these hooks, we can collect all the information we need to understand what goes on in the heap (there are more functions like posix_memalign and other aligned allocators but I’ve decided to limit the scope to the more common functions at this point in time). After passing the collected data to the userland, the role of the eBPF program ends and it’s up to the userland program to process and analyze it.
struct event {
    uint32_t pid;
    uint32_t tid;
    uint64_t size;
    uint64_t addr;
    uint64_t caller;
    uint64_t old_addr;
    uint8_t type;
};
With this event structure we can keep track of the state of the heap. Additional information of which function was called and realloc address changes is also documented. Since we keep track of how many chunks are still allocated we can see if there are any memory leaks present in the program after the process exits. We can also maintain a hash table to keep track of freed chunks and look-up during a free event to check if a double free has occurred.
Showcase
Moving forward with these concepts and ideas I’ve decided to wrap it all together as a project with a text-based UI. Tachi has all the above features implemented in it and can hook into a process dynamically to trace the above mentioned functions.
Beside being able to detect bugs like double free and simple memory leaks, it can work with debuggers to further help with debugging and provide the information immediately.
Example: how2heap - house_of_botcake / PotluckCTF2023
Let’s check out a CTF challenge from PotluckCTF2023, this challenge is featured in the how2heap repository (recommended for anyone who wants to learn heap exploitation techniques in Linux GLIBC). The “house_of_botcake” entry refers to the “Tamagoyaki” challenge from PotluckCTF2023, the challenge contains a double free vulnerability which we can use to demonstrate Tachi.
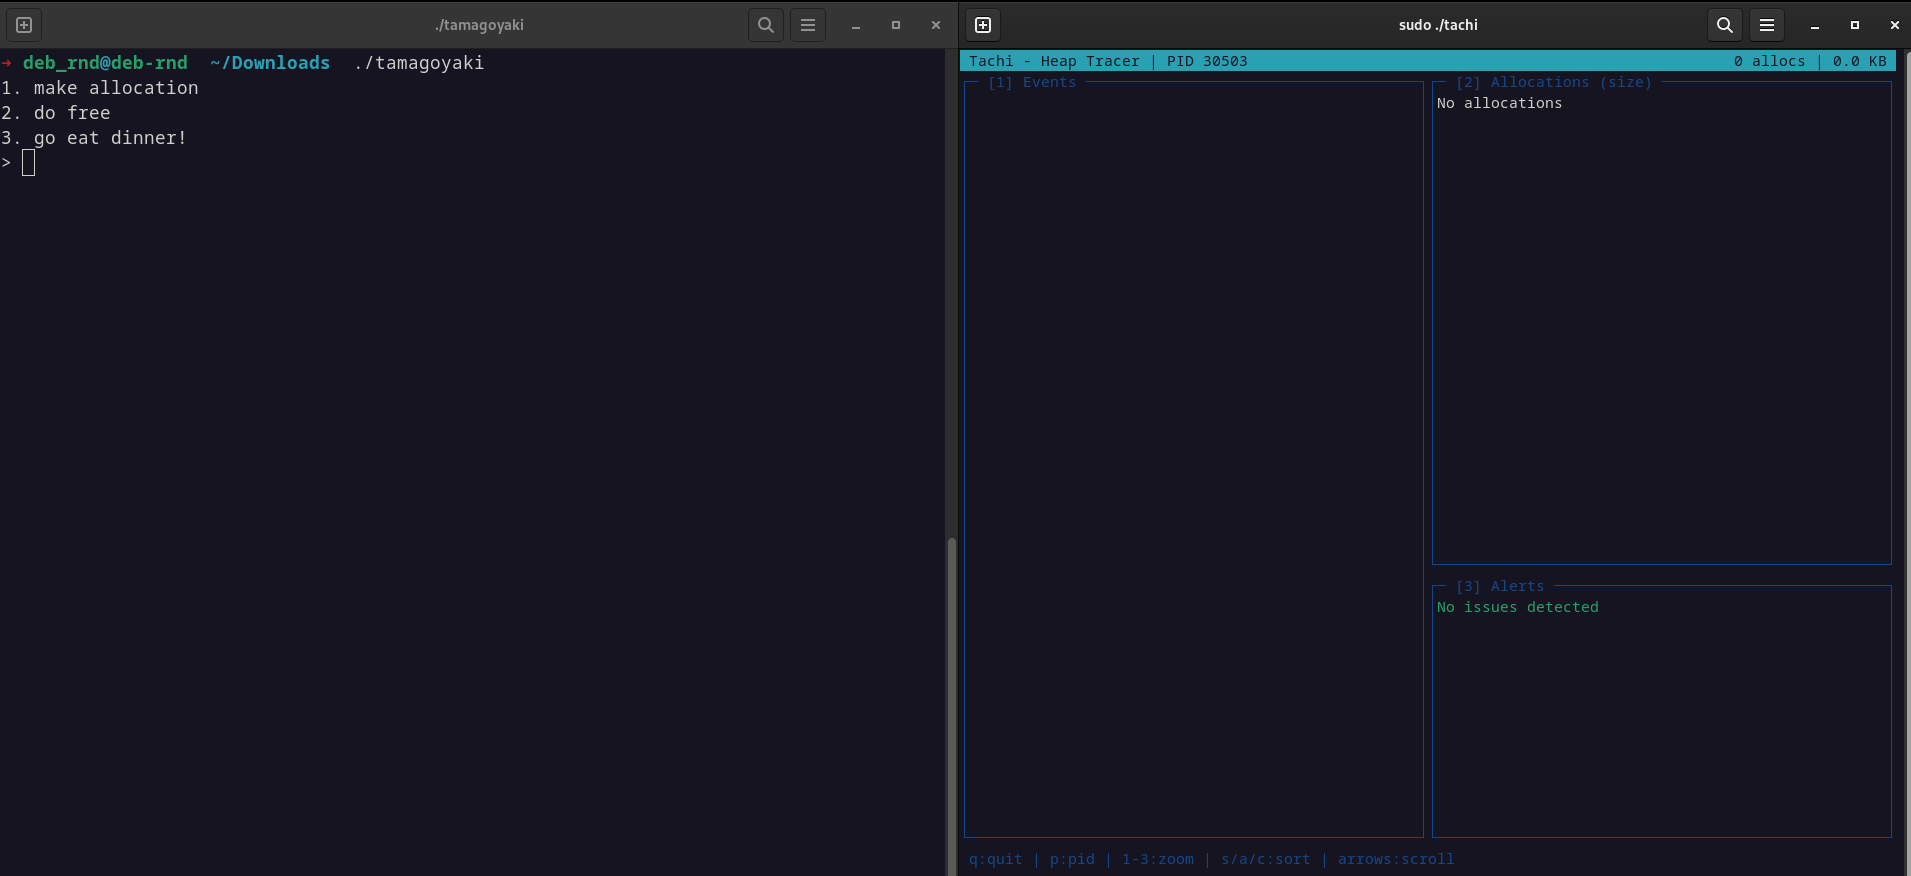
The challenge presents a simple action menu, “1” allocates a buffer, “2” frees a buffer.
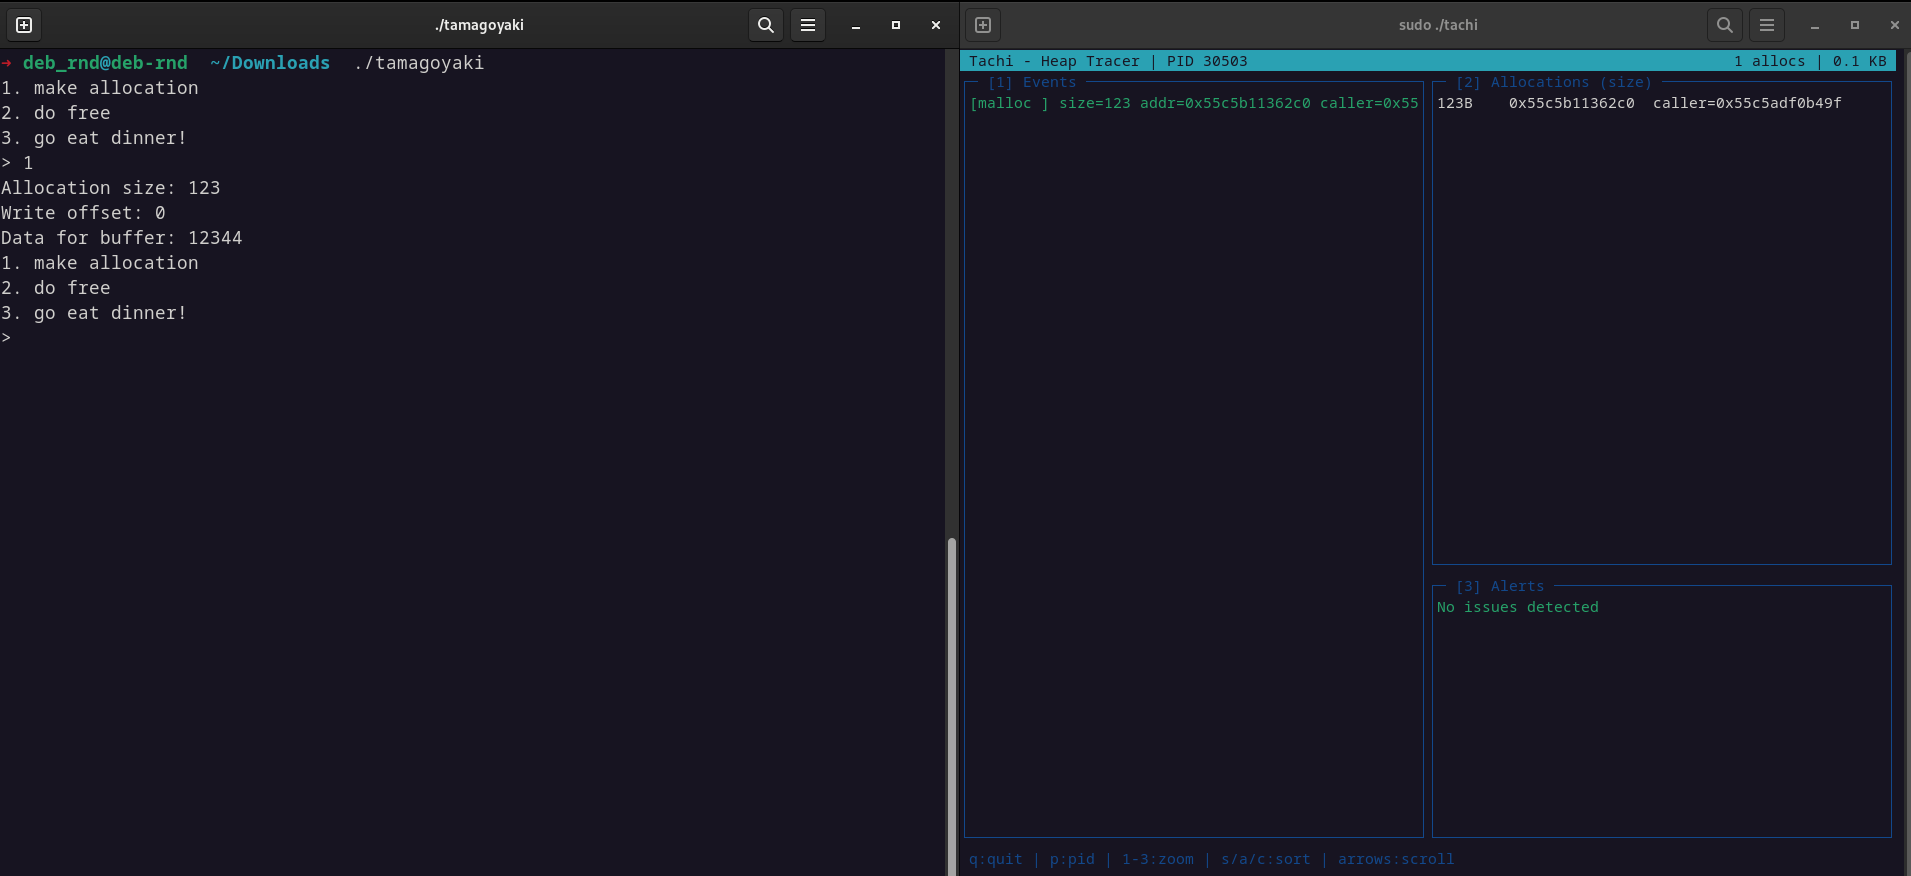
 We choose “1” to allocate a buffer of size 123 bytes. As we can see, Tachi traces it.
 Let’s proceed to call free on that buffer
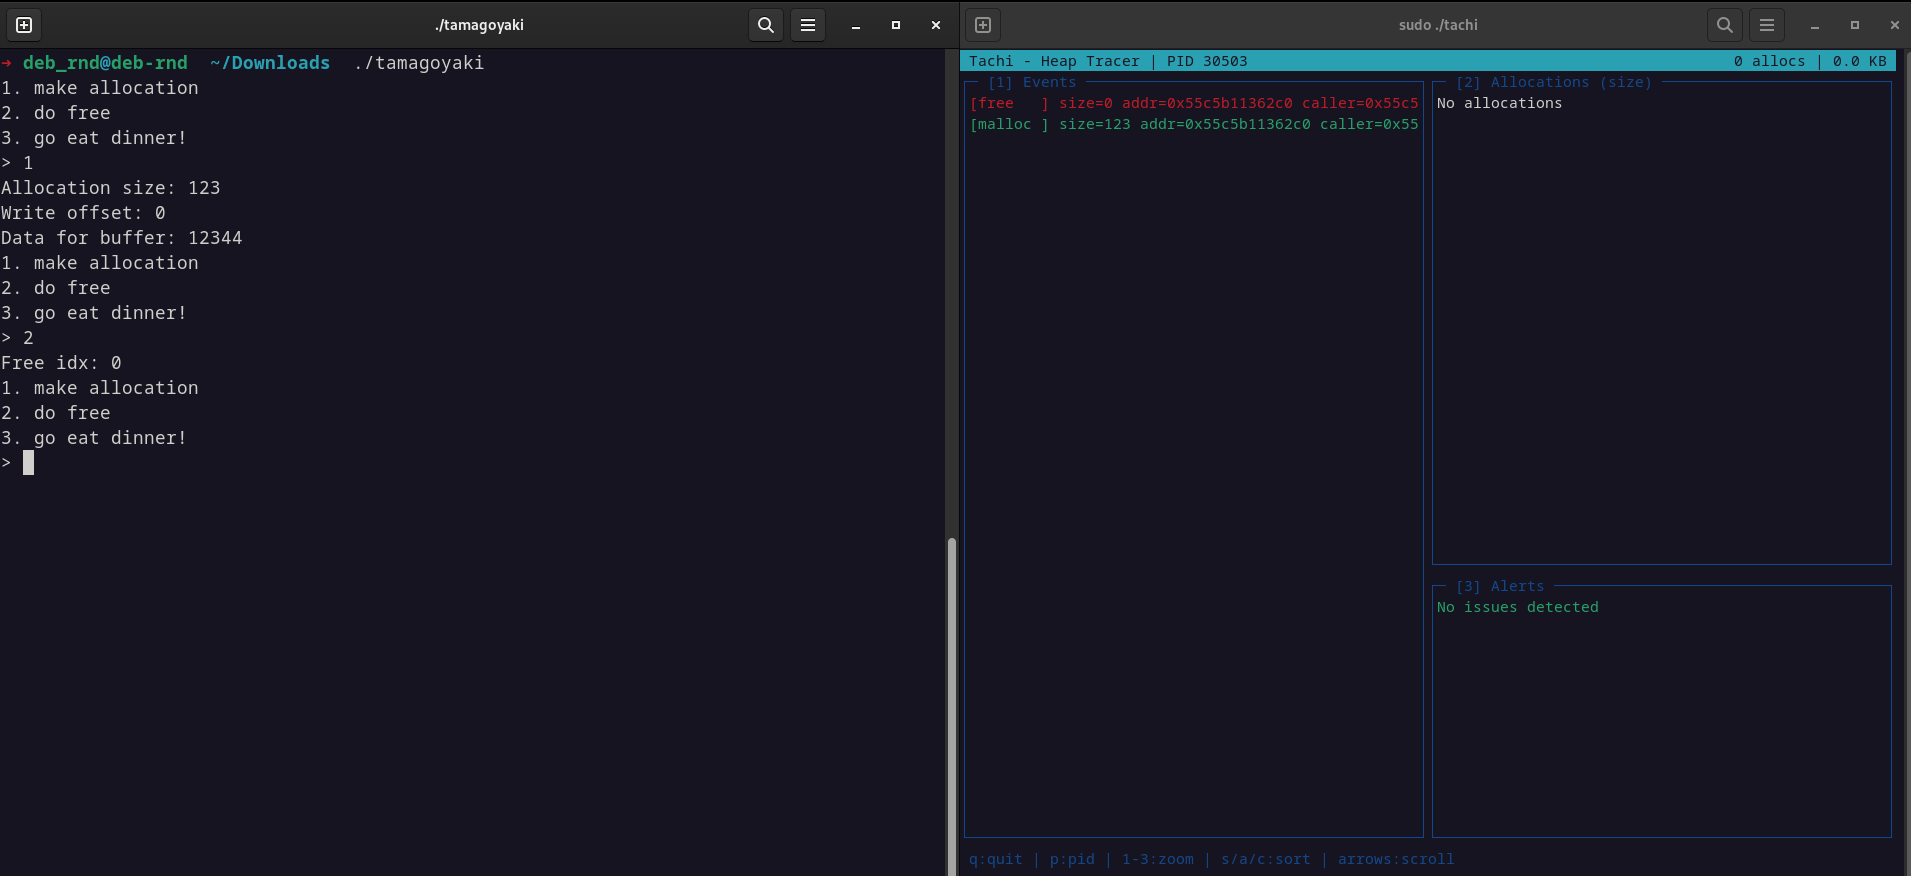 As we saw from the event, the buffer was indeed freed. Let’s try to free that buffer again :)
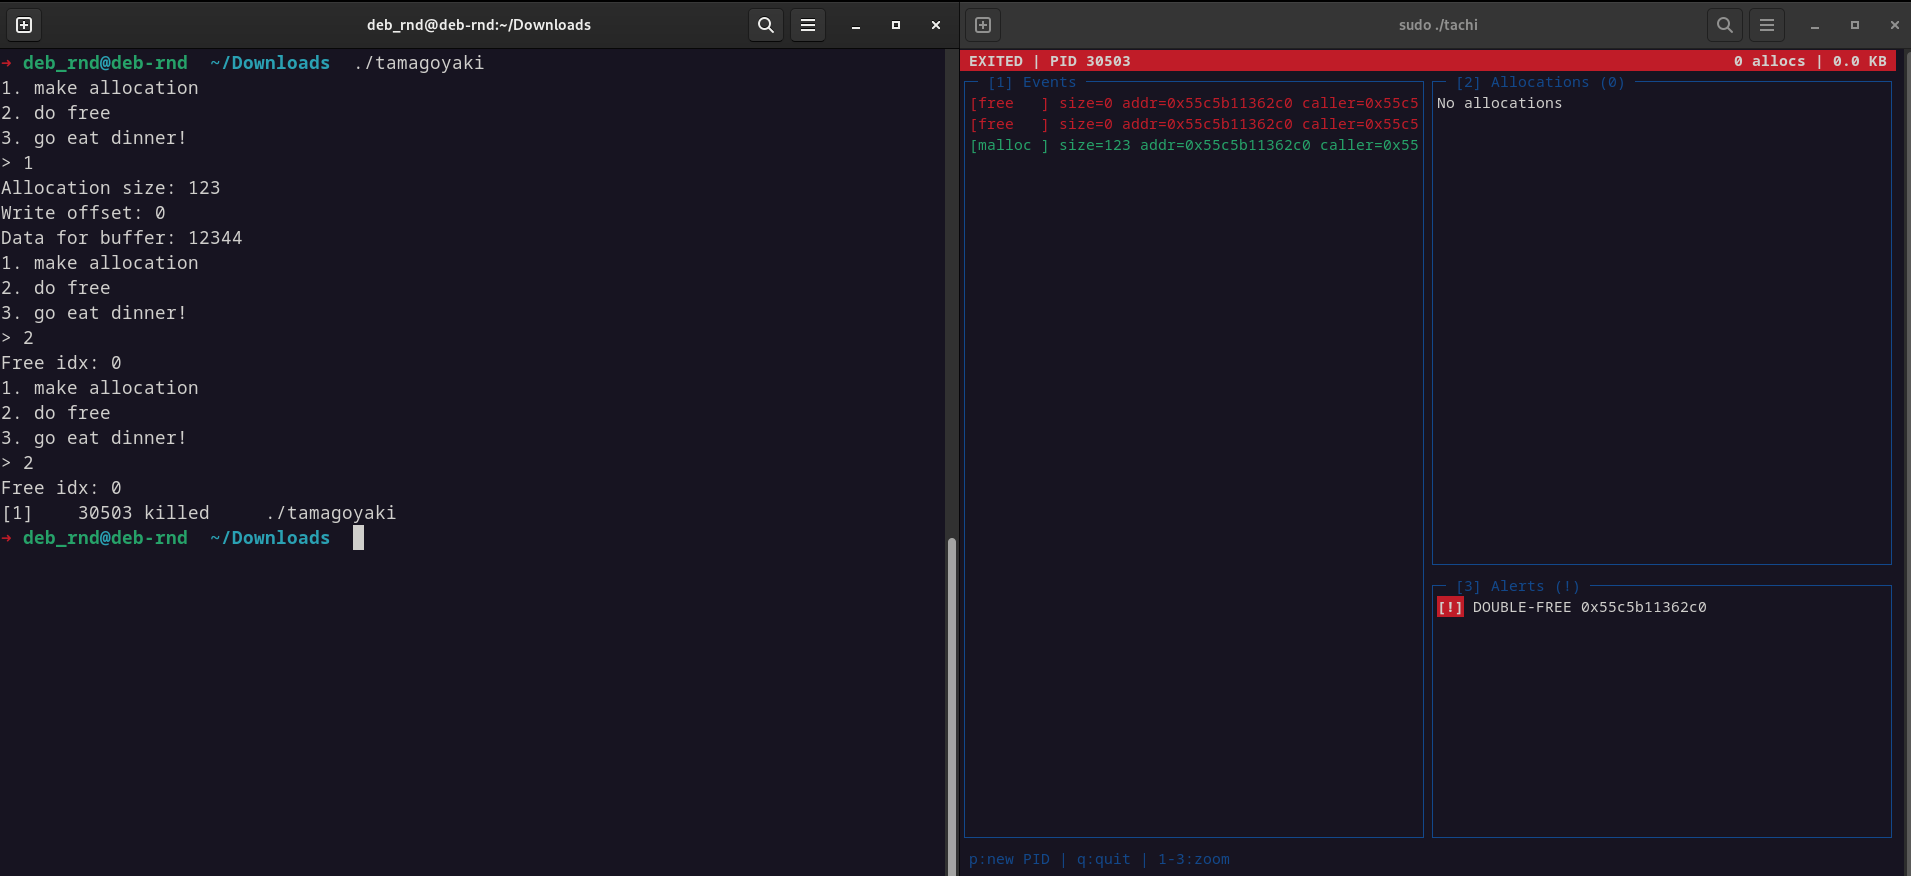 We got a double free (the crash says killed instead of “double free detected” due to a seccomp strict rule being set in the code) and Tachi captured the event!
Future work
There are additional features I might implement someday like expanding to more allocation functions and supporting different allocators.
References
- First post - Dark eBPF – Weaponizing eBPF for covert communications
- Tachi source code - https://github.com/AtoZ132/Tachi